Establishing a baseline and using integer arithmetic
Making a ternary reasoning model fast in vLLM
Earlier development stage. Implementation speeds here describe this stage of the work. See the latest published comparison for the current checkpoint.
Part 2 suggested that 25 tokens per second left plenty of room to improve. I first needed a fair baseline. Then I could check whether PQ2 support was using the right arithmetic and reading weights efficiently.
Three changes followed on 1–3 October: integer arithmetic for generation, a better weight layout and a tensor-core path for reading prompts. Integer arithmetic made the biggest difference. Each change also needed its own correctness checks.
Measurement note. Unless noted, results use one RTX 3090 Ti at 275 W, BF16 intermediate values and a single-GPU model (TP = 1). CUDA graphs record sequences of GPU operations so they can be started again with less CPU overhead. The implementation is in my PQ2 plugin fork.
Establish a matched baseline
An earlier informal comparison had suggested llama.cpp was five times faster. Before changing anything, I wanted a fair comparison. Both programs ran on the same physical GPU, received exactly the same input tokens and generated 256 output tokens. They always chose the highest-scoring next token, called greedy decoding.
I used two repeats and 192 requests in total. I also built llama.cpp for these GPUs; my existing copy had been built to run only on the CPU.
Request performance
| Prompt tokens | Concurrent requests | vLLM aggregate tok/s | llama.cpp aggregate tok/s | Gap |
|---|---|---|---|---|
| 128 | 1 | 25.25 | 55.46 | 2.20× |
| 128 | 4 | 24.72 | 105.18 | 4.25× |
| 1024 | 1 | 22.84 | 47.64 | 2.09× |
| 4096 | 1 | 16.39 | 30.85 | 1.88× |
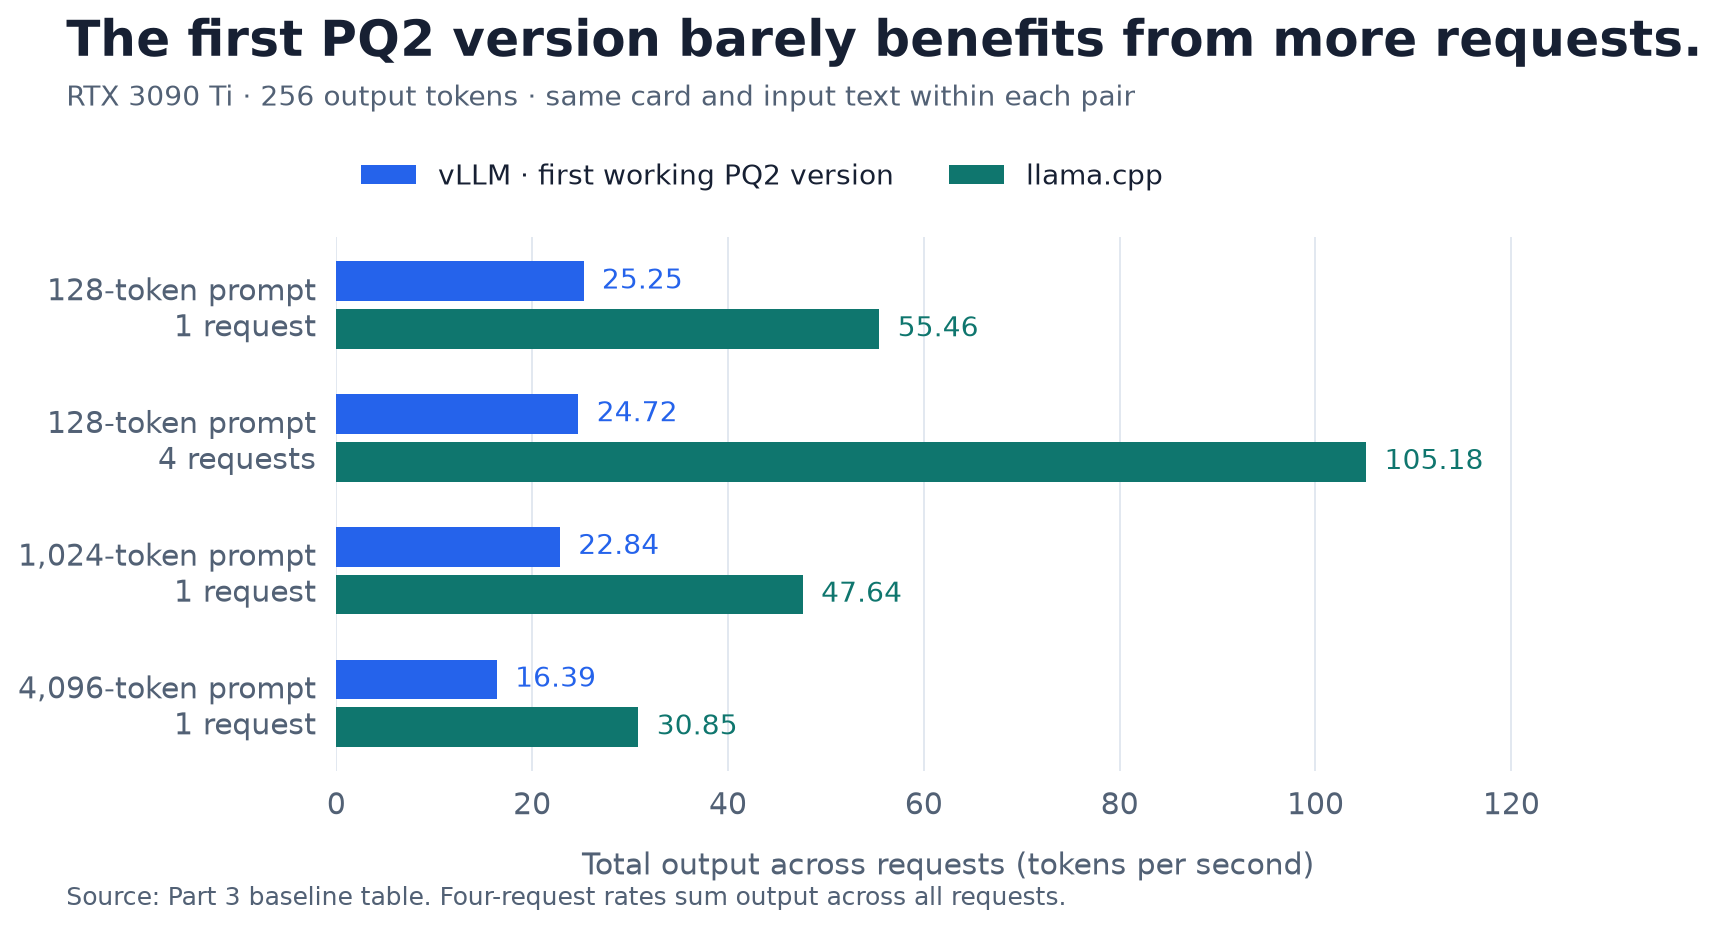
Same GPU and workload within each pair. The four-request row reports aggregate throughput. SVG version.

At 128 prompt tokens and concurrency 1, the median time per output token was 38.98 ms vs 17.24 ms. The 5× figure did not reproduce for steady-state prefill: the TTFT gap at long prompts was 1.5–1.65×. Batched decode exposed the larger limitation: the initial implementation gained almost no aggregate throughput from four concurrent requests.
NVIDIA's Nsight profiling tools record which GPU programs run and how long they take. Their recordings showed where the time went. In the table, “PQ2 matmul” means the weighted calculations using the compressed model:
GPU profile
| Phase | PQ2 matmul share of vLLM kernel time |
|---|---|
| Prefill 1024 | 93.6% |
| Decode, concurrency 1 | 89.9% |
| Decode, concurrency 4 | 94.8% |
Three findings set the agenda:
- No weight reuse in batched decode. A four-token gate/up call took 1025 µs versus 245 µs for one token (4.18×). The kernel processed each token as if the others didn't exist.
- Different arithmetic. The compiled GPU instructions (called SASS) showed llama.cpp using
IMMA.16832.S8.S8(INT8 tensor cores) for prefill andIDP.4A(DP4A) for decode. vLLM usedHMMA.16816.F32.BF16, unpacking ternary codes into BF16 first. These were exactly the integer paths sketched in part 2. - Recompilation spikes. The Triton kernel declared the token count
Mastl.constexpr. Every new batch shape (256 tokens, then 258, then 1025…) compiled a fresh variant at 338–435 ms each. The first batch of a run saw 5.6–6.0 s TTFT, and one sweep left 61 compiled variants in the cache.
The GPU was idle for less than 0.7% of the trace. Removing CPU or scheduler gaps could barely change this result; most of the opportunity was inside the kernels.
Make the arithmetic fit the format
First, stop rebuilding the same program
I started with a change to compilation. The compiler had treated each token count as a reason to build a new GPU program. I changed it to let one compiled program accept different token counts: @triton.jit(do_not_specialize=["M"]). All 14 paired checks produced exactly the same output. The startup delays disappeared. Large groups of tokens changed little (−1.1% to +0.4%); small groups became 2–9% slower, a trade I accepted at this stage.
A useful false start: floating-point batching
My first attempt at batched decode was a floating-point batched GEMV: up to 16 tokens share each unpacked weight tile, with FP32 accumulation. At M = 4 it was 1.70–1.90× faster than native (gate/up 1.005 → 0.554 ms), and in serving it lifted concurrency-4 throughput from 25.72 to 44.29 tok/s (1.72×).
But it was slower than native at M = 1 and regressed most cases at M ≥ 5. Two of eight greedy test outputs diverged. And the SM clock rose from 945 to 1425 MHz during the candidate run.
That last detail was my first hint that on a power-capped card, a more efficient kernel also changes the clock it runs at. It didn't get the attention it deserved until part 5.
I kept the batched GEMV as an M = 4-only experiment and moved to the real target.
Calculate with small integers
The idea was to convert each group of input numbers to small integers once, then reuse them for all the weight rows. Ampere has instructions that calculate with these integers efficiently. Rounding the inputs introduces some error, so this needs both a speed measurement and an accuracy check.
Reusing part 1's four-element example, ternary weights [−1, 0, +1, +1] and integer activations [20, 30, 40, 10] have integer dot product −20 + 0 + 40 + 10 = 30. With activation scale 0.1 and weight scale 0.5, the contribution is 30 × 0.1 × 0.5 = 1.5.
DP4A computes four such integer products together. In the real model the activation scale is chosen per group, and rounding those activations is the source of the new error.
This is the core idea from Part 2, implemented in the input-quantisation program and integer calculation:
Quantise the activation to INT8 per 128-element group. The scale is max|x|/127 in FP32, with round-half-to-even:
@triton.jit
def _quantize(X, Q, S, K: tl.constexpr, GROUP: tl.constexpr = 128):
    block = tl.program_id(0)
    i = tl.arange(0, GROUP)
    a = tl.load(X + block * GROUP + i).to(tl.float32)
    scale = tl.max(tl.abs(a), 0) / 127.0
    normalized = tl.div_rn(a, tl.where(scale > 0, scale, 1.0))
    q = tl.minimum(127.0, tl.maximum(-127.0,
            tl.extra.cuda.libdevice.nearbyint(normalized)))
    tl.store(Q + block * GROUP + i, q.to(tl.int8))
    tl.store(S + block, scale)
Turn four packed 2-bit codes into one 32-bit word of four signed INT8 values.
Issue
dp4a.s32.s32via inline PTX. That is 32 DP4As per 128-group, accumulating in INT32.Multiply by (activation scale × weight scale) once per group, accumulating across groups in FP32.
The first version used a fixed 16-row × 4-block tile, and weights stayed packed. Against the native kernels on the five model shapes, it won all 120 measured cases:
Component test
| M | Native time / integer time |
|---|---|
| 1 | 1.49–1.70× |
| 2 | 2.53–2.81× |
| 4 | 4.09–4.90× |
| 8 | 1.58–2.59× |
| 16 | 1.05–1.64× |
At M = 4 the integer kernel was also 2.5–2.8× faster than the earlier floating-point batched GEMV. It used 37–64 registers per thread, with no temporary values spilling into slower memory.
Did it change the answers?
There are three distinct checks here. A projection error checks one layer's arithmetic; a logit comparison checks the model's predicted distribution over tokens; a task score checks whether an answer is correct. Passing the first check does not establish the third.
Before measuring requests, I wrote a comparison program. It feeds both versions the same eight prompts and the same continuation tokens, checking 512 positions. Giving both versions the same history is called teacher forcing: a difference at one position cannot change the input at the next. It compares the scores for every possible next token, called logits, using the initial PQ2 version as the reference.
- Native vs native repeat: exactly zero difference. This is the control.
- Integer vs native: mean KL 0.000297, mean total-variation distance 0.436% (max 5.34%), and 1 of 512 argmax changes. That one change happened at a position where the native logits were exactly tied.
KL and total variation measure how much the next-token probability distribution changes; zero means no change. Argmax means the highest-scoring token. Here it changed once in 512 positions, at an exact tie in the reference scores. These checks describe numerical differences; task evaluations still need to check whether answers remain correct.
I checked the earlier floating-point program the same way. Only 0.003–0.013% of its outputs differed, almost all by the smallest representable BF16 step, called one ULP. Comparing with a more precise FP64 calculation showed neither version was consistently closer. Adding values in a different order changed rounding. Where two next-token scores are almost tied, even a small rounding change can produce different text, so numerical checks need to be followed by answer-quality tests.
Serving
Behind an opt-in GGUF_PQ2_INT_GEMV=1 (for M ∈ {1, 2, 4, 5, 8} on the five measured shapes), on 128-in / 128-out serving:
Request performance
| Concurrent requests | Initial aggregate tok/s | Integer aggregate tok/s | Gain | TPOT initial → integer |
|---|---|---|---|---|
| 1 | 25.25 | 38.92 | 1.54× | 38.36 → 24.44 ms |
| 4 | 25.35 | 81.73 | 3.22× | 152.95 → 43.43 ms |
| 8 | 72.72 | 126.94 | 1.75× | 99.28 → 52.25 ms |
The concurrency-8 baseline is already faster because the native path switches to its GEMM at M = 8. Memory went up by 16 MiB, for scratch.
In a decode trace, PQ2 matmul was still 88.4% of kernel time. Hadamard took 1.37% and activation quantisation 0.72%. Fusing those two would never be worth more than about 2%.
Make the weights cheaper to read
Unpack four weights with fewer instructions
Turning four 2-bit codes into four signed bytes sounds trivial. Done naively it is four shift/mask/subtract sequences per word, and with only one multiply-add per weight byte at batch 1, instruction count matters.
The unpacking sequence is:
- Spread the four codes so each sits in the low bits of its own byte, giving values 0–3.
- Add
0x7F7F7F7F. Each byte becomes 127–130, and no byte can carry into its neighbour. - XOR with
0x80808080. Flipping the top bit turns 127→−1, 128→0, 129→+1 and 130→+2 as signed bytes.
Code detail: GPU implementation
spread = (packed & 3) | ((packed << 6) & 0x300)
spread |= ((packed << 12) & 0x30000) | ((packed << 18) & 0x3000000)
return ((spread.to(tl.uint32) + 0x7F7F7F7F) ^ 0x80808080).to(tl.int32)
In SASS, logic ops (LOP3.LUT) dropped from 594 to 402 and integer adds (IADD3) from 330 to 138. The DP4A count stayed at 256.
- Kernel time: 1.04–1.08× median speedup, with all 100 comparisons bitwise identical.
- Serving: concurrency 1 went from 38.74 to 41.62 tok/s (+7.4%). Concurrency 4 and 8 gained 2.4% and 1.8%.
I also tried a tile sweep: 24 configurations, with up to 1.16× on individual calls. I deliberately didn't promote any of them yet. Changing the reduction tile changes rounding, and I wanted to land the numerically neutral changes first.
Separate the codes from their scales
Separating codes from scales should make reads easier without changing any weight. I could therefore require exact output equality before asking whether it was faster. That was a stronger correctness check than the tolerance needed for activation quantisation.
Part 2 argued that the interleaved 34-byte block layout prevents aligned wide loads. A standalone experiment separated codes and scales into aligned buffers. On top of the tuned integer kernel it gained 1.10–1.33× (FFN down at M = 1: 70.13 → 53.15 µs), again bitwise identical.
Preparing this change for deployment meant rewriting every PQ2 parameter once at load time, before CUDA graph capture. The result is one allocation containing all code bytes followed by all FP16 scales: still exactly 34 bytes per 128 weights, with no second copy.
Code detail: GPU implementation
if PREPARED:
    address = row * (K // 4) + block * 32 + byte              # code plane
else:
    address = row * STRIDE + block * 34 + 2 + byte            # interleaved
From pq2_layout.py.
Every reader had to understand the new layout: integer decode, floating decode, native prefill, MMQ and the embedding lookup. (In the standalone aligned-buffer experiment, the generated SASS had five LDG.E.128 sites against one for the interleaved layout.) Both modes held exactly 7,137,280,000 packed bytes.
The bug. The first serving run produced invalid output. vLLM caches compiled graphs, and its cache key didn't know about my environment variable. A graph compiled against the raw layout was silently reused with prepared weights.
The compilation-cache fix was to register GGUF_PQ2_PREPARED and a layout version (planes-v1) as compilation-cache factors, plus a regression test. The invalid runs are quarantined in invalid-cache-reuse/ and excluded from every number here. The lesson: any switch that changes what a kernel reads must change the compile identity.
With the cache fixed, prepared weights on top of integer decode gave:
Request performance
| Concurrent requests | Raw aggregate tok/s | Prepared aggregate tok/s | Gain |
|---|---|---|---|
| 1 | 42.48 | 46.73 | +10.0% |
| 4 | 83.92 | 89.49 | +6.6% |
| 8 | 130.21 | 136.96 | +5.2% |
Decode kernels improved 1.03–1.12×. But TTFT got slightly worse (191.7 → 203.0 ms at c1), because prefill kernels on some shapes regressed 3–10%. So the layout stayed opt-in.
Use matrix hardware for prefill
For reading prompts, I used the GPU's tensor cores: hardware that multiplies blocks of numbers together. The new program converts inputs to 8-bit integers and processes them against the compressed weights. The code calls this MMQ, following llama.cpp's name for this approach. It sums each group's integer products before applying that group's scale.
Component test
| Projection | M=128 | M=1024 |
|---|---|---|
| FFN gate/up | 1.46× | 1.50× |
| FFN down | 1.23× | 1.42× |
| Output head | 1.49× | 1.59× |
At M = 1 it runs at only 0.30–0.71× the reference rate, so it only dispatches for M ≥ 128. A follow-up that loads 32 bytes per block at once was byte-identical and 2.29× faster on prepared weights. In serving at a 4096-token prompt, TTFT went from 5802 → 4182 ms against the previous MMQ kernel.
Quality was more delicate than for decode, because prefill errors feed every later token. On an 8-question GSM8K smoke test, MMQ got 7/8 against native's 8/8, and the miss was reproducible. So I tried smaller activation groups:
Component test: numerical error and latency
| Activation group | Projection RMSE | Latency cost |
|---|---|---|
| 128 | 0.004343 | — |
| 64 | 0.004134 (−4.8%) | +10.2% |
| 32 | 0.003897 (−10.3%) | +52.4% |
Group 64 fixed the two failing questions in repeats. But on a larger 128-question GSM8K cohort, native, MMQ-128 and MMQ-64 scored 122, 122 and 121. The small-sample advantage evaporated. MMQ-128 stayed as an opt-in prefill path, and I did not ship the smaller groups.
Where things stood on 3 October
Read the following as comparisons within each row. Here native means the initial PQ2 implementation added during this work. It does not mean PQ2 support shipped in the upstream plugin. The final row is dominated by processing a long prompt, so its overall output rate answers a different question from the sustained decode rows.
A same-GPU, three-repeat serving study:
Request performance
| Workload | Native | Integer | MMQ-128 | Prepared-native |
|---|---|---|---|---|
| 128 in / 256 out, c1 | 25.01 | 43.90 | — | — |
| 128 in / 256 out, c4 | 24.85 | 88.46 | — | — |
| 128 in / 256 out, c8 | 71.46 | 140.56 | 72.75 | 79.11 |
| 4096 in / 32 out, c1 | 4.04 | 4.27 | 6.23 | — |
Integer decode was the largest contributor at this stage. A later leave-one-out study (part 4) found that removing it alone cost −42.7% of single-request throughput. Removing prepared weights cost −8.7%, and removing MMQ made no measurable difference to generation speed (−0.24%).
In three days, integer decode plus prepared weights brought single-request generation from about 25 to about 47–50 tok/s. Prefill had its own path, and layout changes had helped generation while occasionally hurting prompt latency. There was no single switch that improved every phase.
The master switches remained opt-in. Numerical comparisons showed small changes from INT8 activation rounding, while task-level acceptance criteria were still unresolved. The 128-question prefill test also showed why a promising result on eight questions was too small to choose a default from.
The next problem was narrower: where was the remaining single-request kernel time going? Part 4 uses saved inputs from the real model to separate useful changes from attractive microbenchmark results.
The component reference separates arithmetic paths, weight layouts and activation-group checks, with the recorded setup and selected code.
Sources
Implementation and instruction references:
- triton/pq2_int_gemv.py: Integer decode implementation; input quantisation and prompt processing are in pq2_mmq.py.
- NVIDIA PTX ISA: DP4A: packed integer dot-product instruction used by decode.
- llama.cpp: reference engine used in the matched comparisons.